Gaussian Mixture Models
Univariate Gaussian Mixture Models
Implementation
ugmm <- function(X, K, tol=0.0001, maxit=1000) {

  # Basics of X
  N <- length(X)

  # Initialise means
  mu <- sample(X, K)

  # Initialise variances
  theta <- rep(var(X), K)

  # Initialise mixing proportions
  prop <- rep(1/K, K)

  # Initialise individual label probabilities and weighted densities
  g <- matrix(0, nrow=N, ncol=K)

  # Initialise the difference
  diff <- Inf
  old <- 0

  # Initialise iterations
  it <- 0

  # EM Algo
  while (it < maxit) {

    # Old values
    oldmu <- mu
    oldtheta <- theta
    oldprop <- prop

    # E-step
    for (k in 1:K) {
      g[,k] <- prop[k] * dnorm(X, mu[k], sqrt(theta[k]))
    }
    g <- g / rowSums(g)


    # M-step
    Nk <- colSums(g)
    for (k in 1:K) {

      # Calculate mu_k
      mu[k] <- sum(g[,k] * X) / Nk[k]

      # Calculate theta^2_k
      theta[k] <- sum(g[,k]*(X - mu[k])^2) / Nk[k]

      # Update mixing proportions
      prop[k] <- Nk[k]/N

    }

    # Calculate log-likelihood
    lli <- numeric(N)
    for (k in 1:K) {
      lli <- lli + g[,k] * (log(prop[k]) + log(dnorm(X, mu[k], sqrt(theta[k]))))
    }
    ll <- sum(lli)

    # Recalulate difference
    diff <- abs(ll - old)

    # Update iterations
    it <- it+1

    # Check
    if (diff < tol) break

    # Assume the loop hasn't ended, update the old ll
    old <- ll

  }

  return(list(it=it, mu=mu, theta=sqrt(theta), prop=prop))

}
Testing the function:
# Simulate draws from 3 distributions
set.seed(1234)
x1 <- rnorm(1000, 0, 1)
x2 <- rnorm(1500, -4, 2)
x3 <- rnorm(500, 2, 0.5)

# Combine into single vector
x <- c(x1, x2, x3)

# Density Plot
plot(density(x))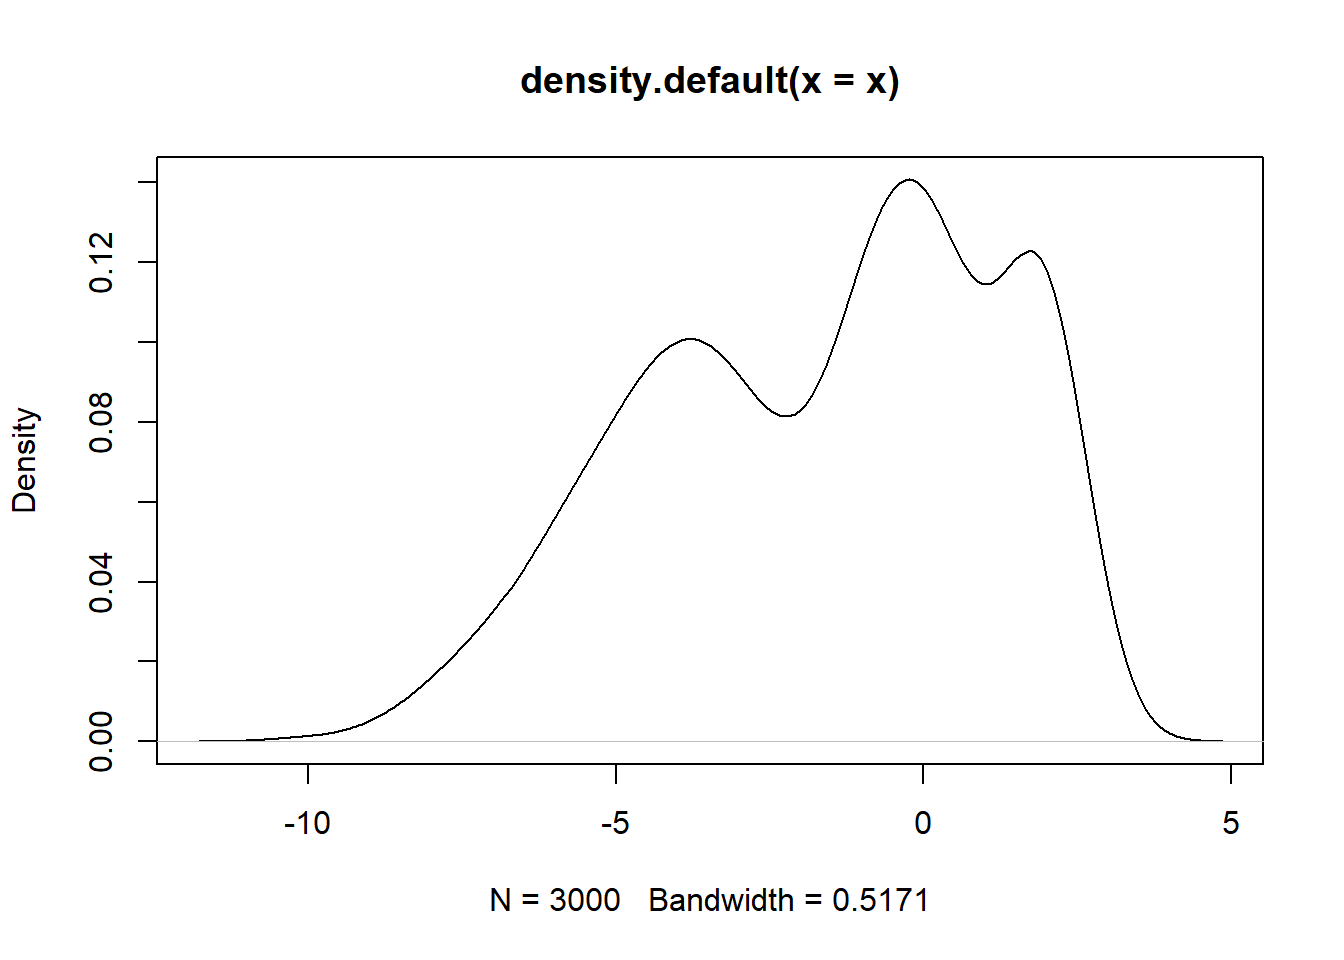
# Estimate clusters
ugmm(x, 3)
## $it
## [1] 231
##
## $mu
## [1] -3.9174651 1.9712504 -0.1162445
##
## $theta
## [1] 2.0231925 0.5045694 0.8715375
##
## $prop
## [1] 0.5054033 0.1863845 0.3082122