K-Means Clustering
Implementation
kmeans <- function(X, K, tol=0.0001, maxit=1000) {

  # X dimensions
  N <- nrow(X)
  J <- ncol(X)

  # Distance to centroid function
  cdist <- function(x, c, k) {
    rowSums(t(t(x) - c[k,])^2)
  }

  # Vector of cluster memberships
  s <- numeric(N)

  # Distances to each centroid
  d <- matrix(0, nrow=N, ncol=K)

  # Kmeans++ initialisation
  C <- matrix(0, nrow=K, ncol=J) #centroids on rows, variables on columns
  C[1,] <- X[sample(1:N, 1),]
  for (k in 2:K) {
    d[,k-1] <- cdist(X, C, k-1) #compute distances to previously initialised centroid
    if (k == 2) w <- d[,1] / sum(d,1)
    if (k > 2) {
      w <- apply(d[,1:(k-1)], 1, min)
      w <- w/sum(w)
    }
    C[k,] <- X[sample(1:N, 1, prob=w),]
  }

  # Loop
  diff <- Inf
  it <- 0
  while (diff > tol & it < maxit) {

    # Membership step
    for (k in 1:K) {
      d[,k] <- cdist(X, C, k)
    }
    s <- apply(d, 1, which.min)

    # Centroid mean step
    old <- C
    for (k in 1:K) {
      C[k,] <- apply(X[s == k,], 2, mean)
    }

    # Checks
    it <- it + 1
    diff <- max(abs(C - old))

  }

  # Output
  return(list(iterations = it,
              centroids = C,
              clusters = s))

}
Testing the function:
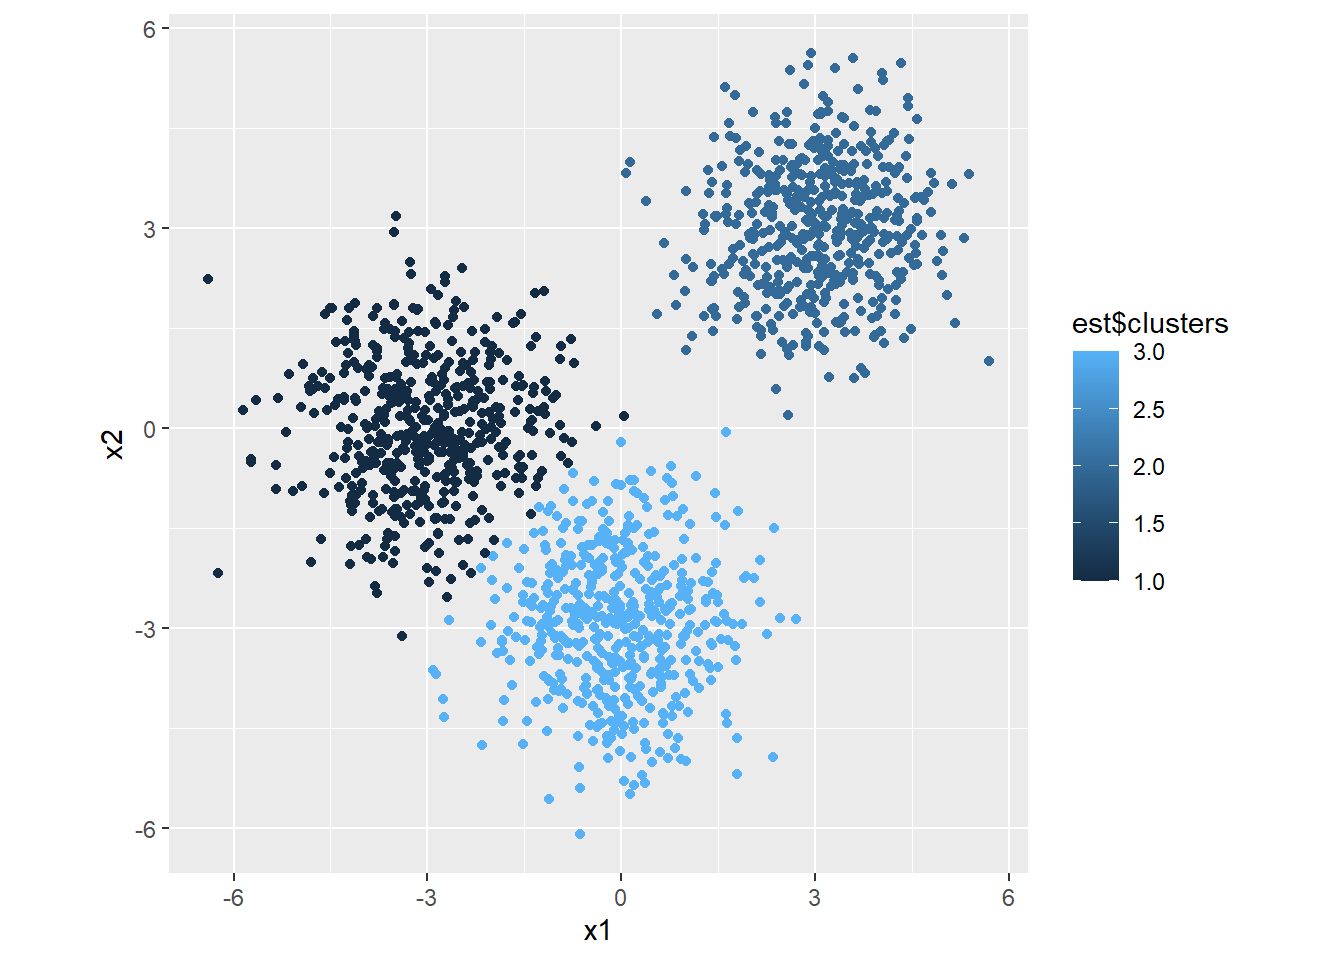
# Simulate draws from 3 distributions
set.seed(1234)
n <- 500
x1 <- c(rnorm(n, -3, 1), rnorm(n, 0, 1), rnorm(n, 3, 1))
x2 <- c(rnorm(n, 0, 1), rnorm(n, -3, 1), rnorm(n, 3, 1))

# Combine into matrix
m <- matrix(c(x1, x2), nrow=n*3, ncol=2)

# Estimate clusters
est <- kmeans(m, 3)

# Plot
library(ggplot2)
ggplot(mapping=aes(x=x1, y=x2, color=est$clusters)) +
  geom_point() +
  theme(aspect.ratio = 1)